Candlestick Charting
Support for candlesticks charting can be found by emailing chrisgokey@gmail.com
Screen shot

Description
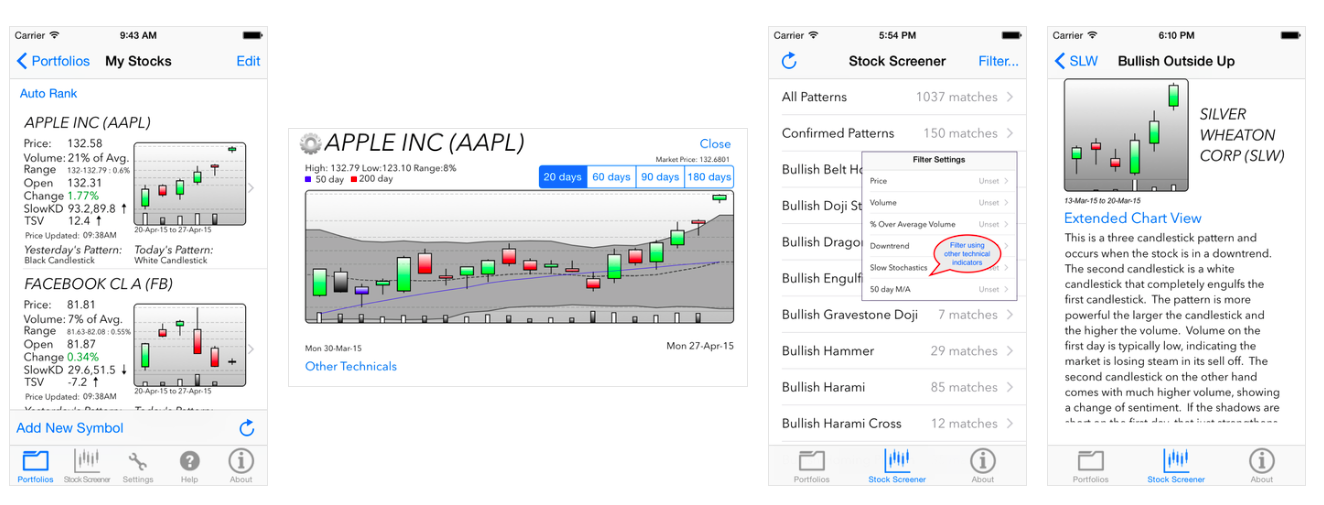
Want to gain an edge in today's competitive market? Candlestick charting, which is a form of technical analysis, is a versatile tool that can be fused with any other technical tool and will help improve any technician's market analysis.
This App covers more than 70 of the most widely recognizable candlestick patterns, analyzes thousands of stocks every day providing detailed analysis of which stocks match these time-proven trading patterns. This tool will help you spot trend reversals quickly and easily, focusing your attention on "high probability" candlestick signals. It takes the complexity out of learning dozens of trading patterns, scanning thousands of stocks, and you will actually learn these patterns as you follow your favorite trading stocks.
In the latest version, some of the most common technical analysis indicators have integrated with this tool to help confirm/deny candlestick signals, which include:
* Slow Stochastic indicators to detect overbought/oversold levels of a security.
* Time Segmented Volume (TSV) indicators to detect buying/selling pressure of a security.
* Moving averages to gauge support/resistance levels (20/50/200 days moving averages)
* Bollinger Bands, providing volatility and upper/lower bounds of a security's channel.
* Relative volume (20/60/90/180 day), graphically represented in each chart.
* Advanced screener with filtering using these common technical indicators coupled with candlestick patterns.
Setup a watch list of your favorite trading stocks. Monitor these stocks as this App automatically detects new patterns develop. See patterns as they develop throughout the day real-time, used either as confirmation of a previous day's pattern or as a key to spotting a new patterns develop.
The visual display of bearish and bullish sentiment will help you towards understanding the emotional dynamic, to help gain insight into whether the trend will reverse or continue, with the ultimate goal of earning a higher rate of return on your investments.
The free version of this App includes:
* Setup portfolios and easily add as many stocks you want to monitor.
* 6 day candlestick chart depicting the securities short term trend.
* Live Market Data (delayed)
* Technicals such as open, close, current price, high, low, and volume indicators.
* More advanced technicals, such as slow stochastic and time segmented volume.
* Plot of slow stochastic showing overbought/oversold levels of a security.
* Plot of Time Segmented Volume (TSV) showing buying/selling pressure of a stock (new indicator that meshes volume/price together).
Paid Subscription Version includes:
* Real time updates.
* 20/60/90/180 day extended charts color coded to show bullish, bearish patterns detected, along with relative volume. Highly interactive chart, zooming, panning, with each candlestick pattern labeled. Draw support/resistance lines directly on the chart.
* Detailed descriptions of the most common candlestick patterns (more being added).
* Advanced technicals including Bollinger Bands show volatility, support/resistance levels
* Fibonacci retracement levels included as part of the extended chart.
* 20/50/200 days moving averages integrated with extended chart.
* Advanced stock screener covering 70 of the most common candlestick patterns
* Advanced filtering blending fundamental technical analysis with candlestick charting, to help narrow down higher probability candlestick patterns.
Disclaimer
Buy/selling securities is inherit with risk and you assume all responsibilities associated with this risk. The information drawn and analysis provided is believed to be reliable but in no way is guaranteed. You assume all risk associated with using the data provided herein and in no way can the developer of this App assume any liability.